Transcriptome-based Multi-scale Network Pharmacological Platform
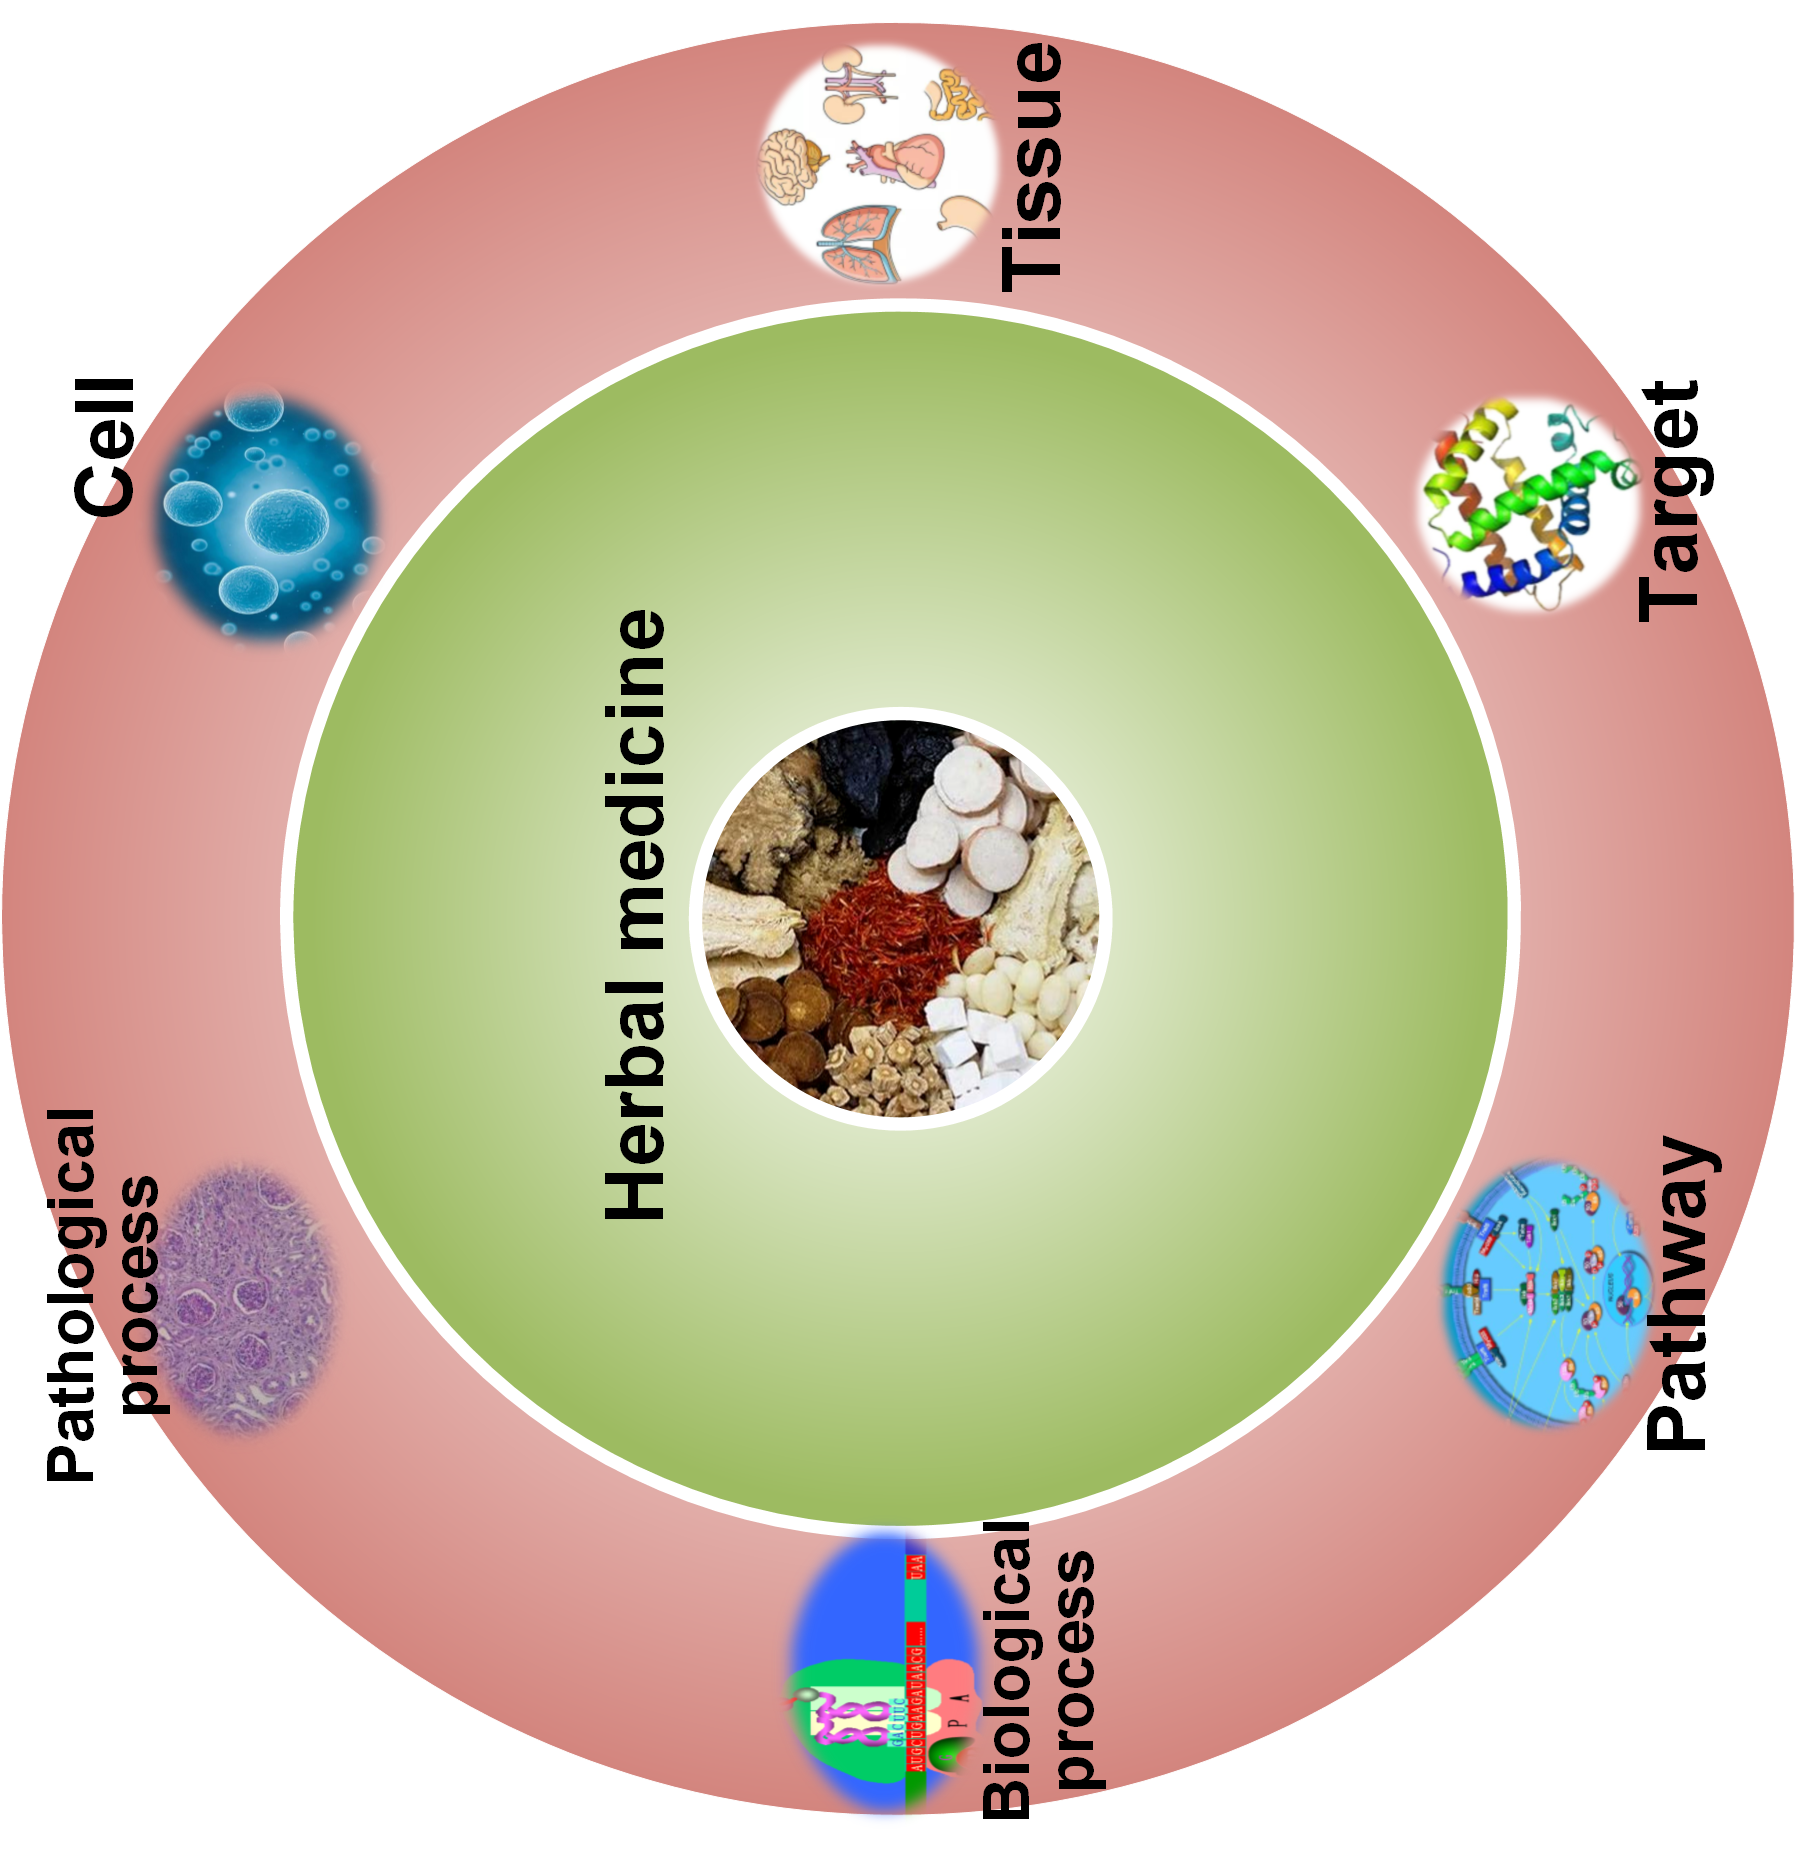
we developed an online transcriptome-based multi-scale network pharmacology platform (TMNP) for exploring the global effect of herbal medicine. Firstly, it is conceived to build specific functional gene signatures for different biological scales from molecular to higher tissue level. Based on these knowledge, TMNP uses pharmacotranscriptomics of herbal medicine as input and builds associations between herbs and biological scales to explore the multi-scale effects of herb medicine.
TMNP that integrates herbal medicine and multiple biological scales into a same framework for multi-scale association analysis, will greatly extend the conventional network pharmacology model centering the chemical components, and provide a window for systematically observing the complex interactions between herbal medicine and human body.
Contact us
Prof. Li Peng
Address: Shanxi Agricultural University, Taigu 030801, Jinzhong, China
E-mail: lip@sxau.edu.cn
Prof. Chen Jianxin
Address: Beijing University of Chinese Medicine, Beijing 100029, China
E-mail: cjx@bucm.edu.cn
Input
Multi-scale analysis
Input data
herbal data information
Distribution of NCS values for each samples
Heatmap of NCS values of different samples
Positively (NCS >0) and negatively (NCS<0) related targets with each sample (FDR <0.05) (sample num >=2)
Correlation btween NCS values of different samples (sample num >=2)
Distribution of NCS values for each samples
Heatmap of NCS values of different samples
Positively (NCS >0) and negatively (NCS<0) related pathways with each sample (FDR <0.05) (sample num >=2)
Correlation btween NCS values of different samples (sample num >=2)
Distribution of NCS values for each samples
Heatmap of NCS values of different samples
Positively (NCS >0) and negatively (NCS<0) related BPs with each sample (FDR <0.05) (sample num >=2)
Correlation btween NCS values of different samples (sample num >=2)
Distribution of NCS values for each samples
Heatmap of NCS values of different samples
Positively (NCS >0) and negatively (NCS<0) related pps with each sample (FDR <0.05) (sample num >=2)
Correlation btween NCS values of different samples (sample num >=2)
Distribution of NCS values for each samples
Heatmap of NCS values of different samples
Positively (NCS >0) and negatively (NCS<0) related cells with each sample (FDR <0.05) (sample num >=2)
Correlation btween NCS values of different samples (sample num >=2)
Distribution of NCS values for each samples
Heatmap of NCS values of different samples
Positively (NCS >0) and negatively (NCS<0) related tissues with each sample (FDR <0.05) (sample num >=2)
Correlation btween NCS values of different samples (sample num >=2)
Distribution of NCS values for each samples
Heatmap of NCS values of different samples
Positively (NCS >0) and negatively (NCS<0) related diseases with each sample (FDR <0.05) (sample num >=2)
Correlation btween NCS values of different samples (sample num >=2)
User guide
TMNP contains two core modules: (i) gene signatures curated for multiple biological scales including target gene, GO, pathway, pathological process, cell and tissue; (ii) algorithms for multi-scale association analysis between query transcriptional profiles and multi-scale gene signatures.
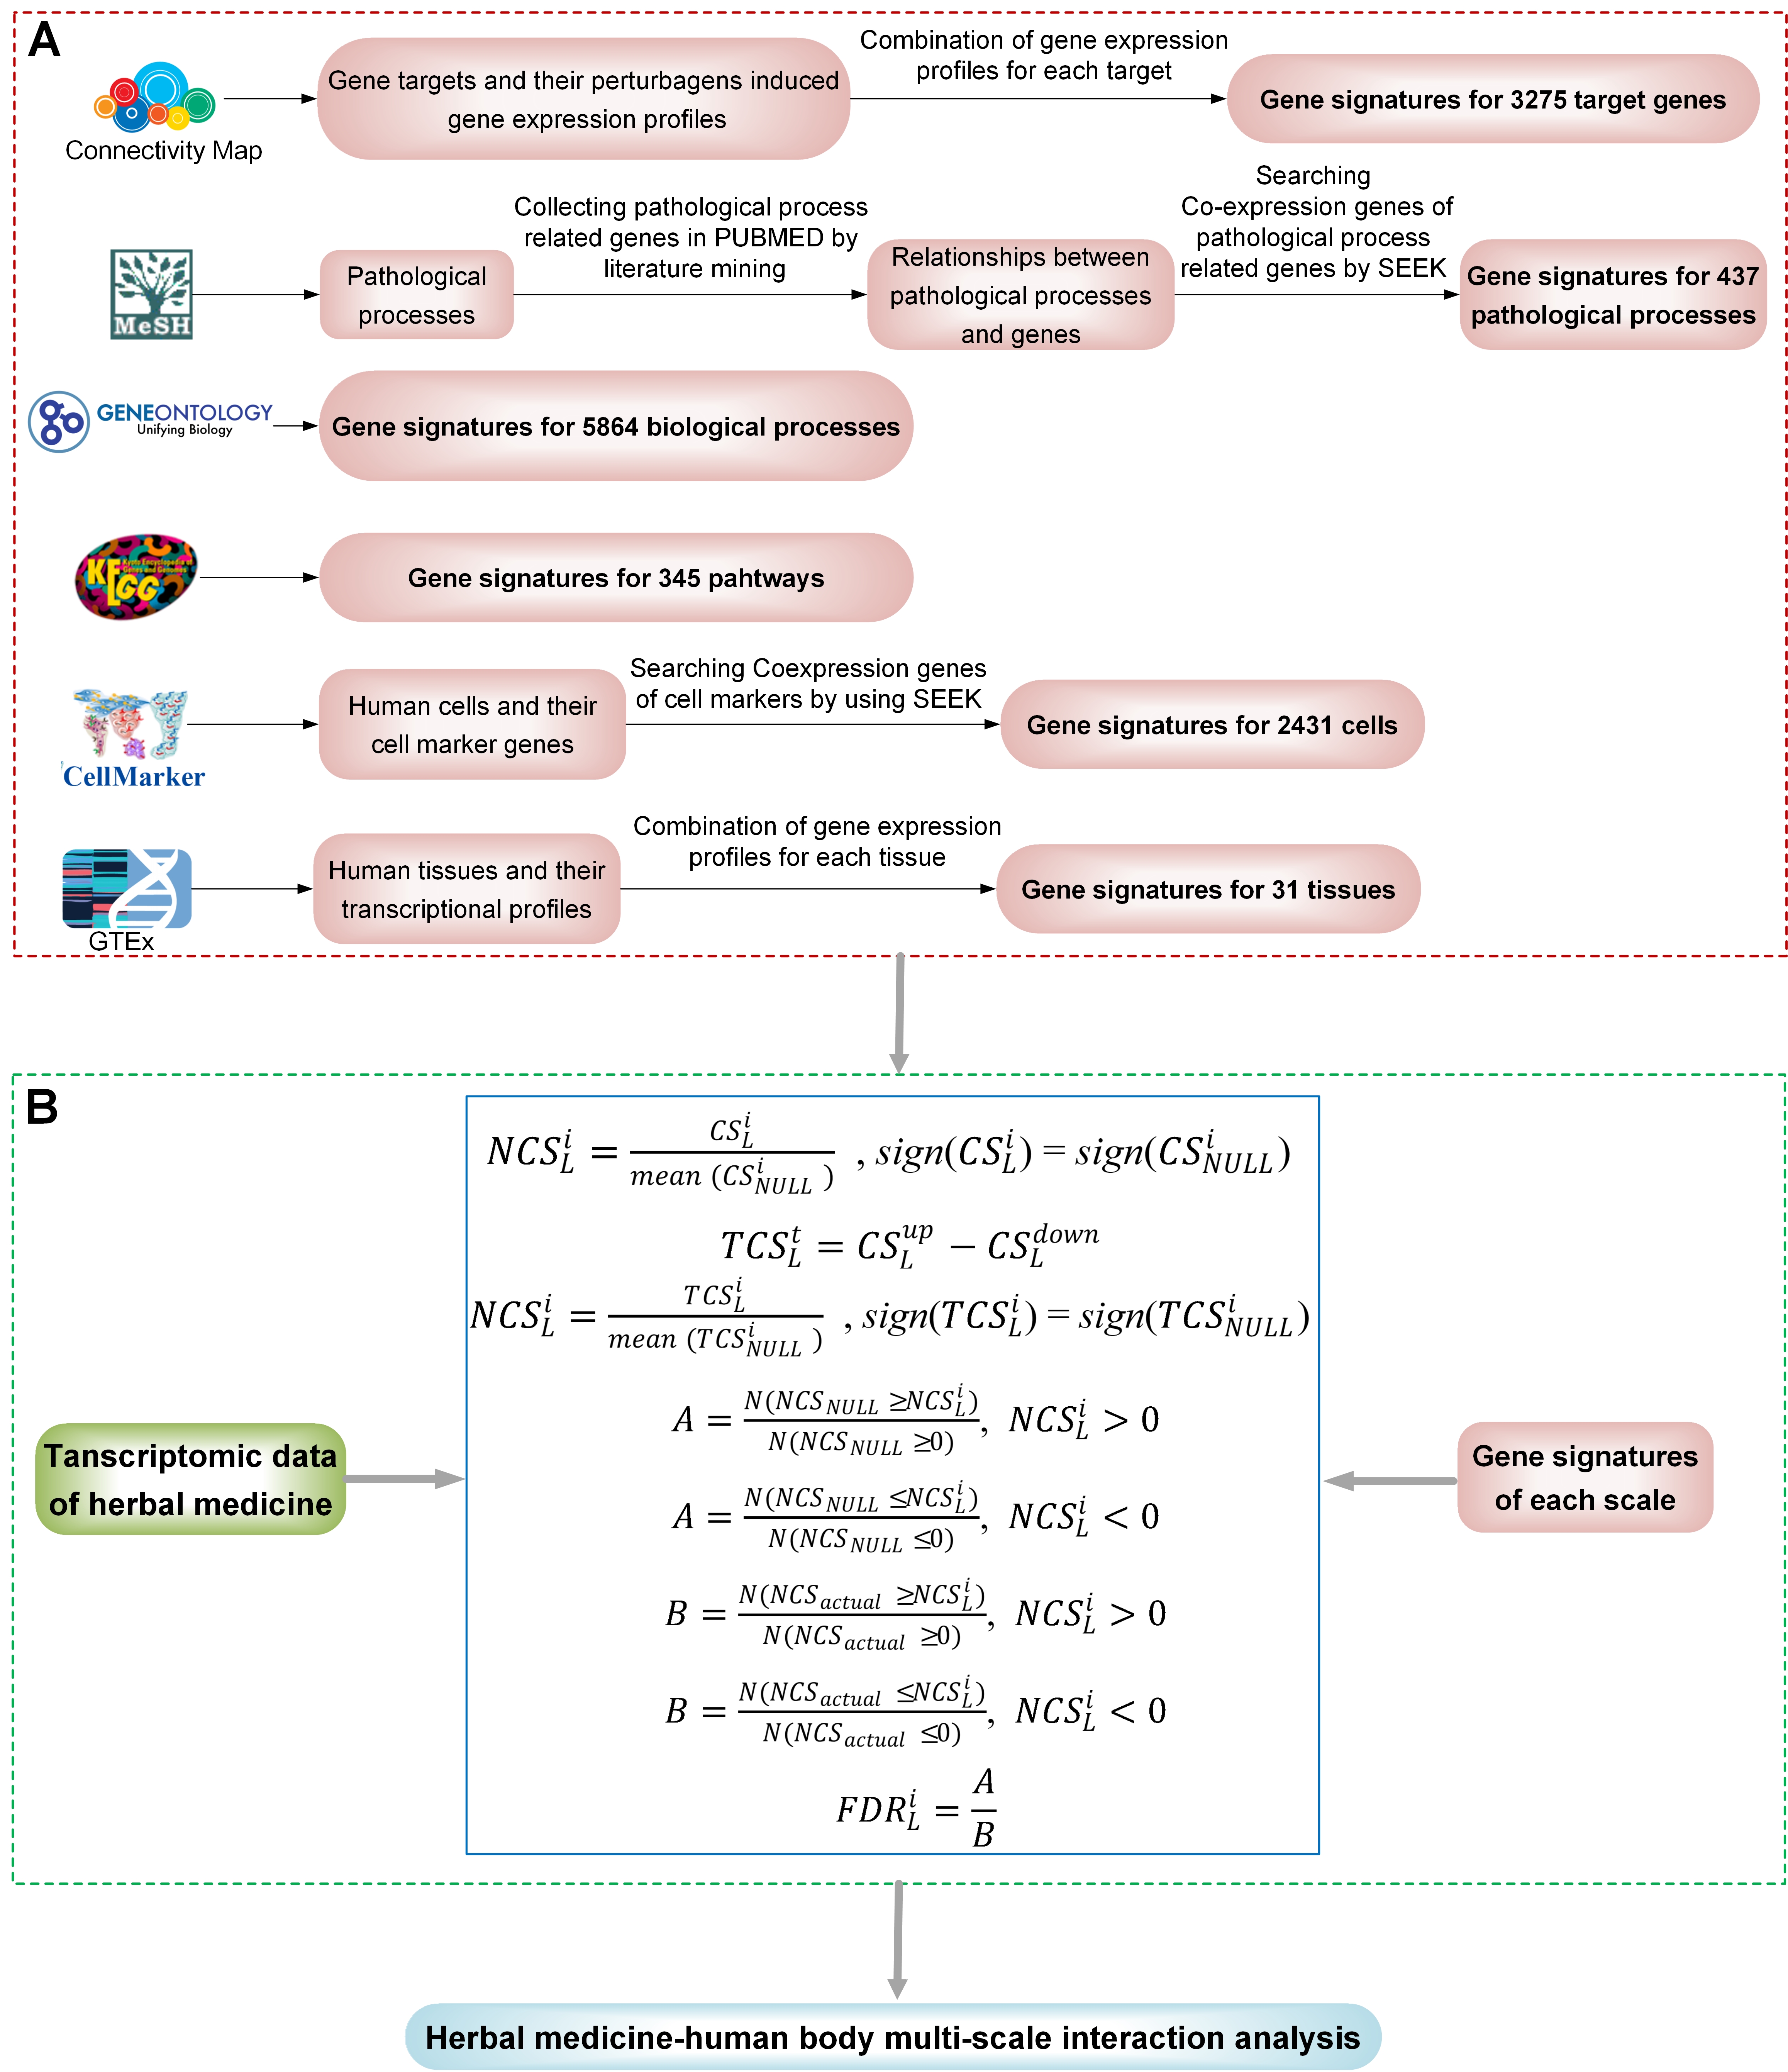
Gene signatures for target genes
For a gene target, its specific gene signature indicate the gene expression profile induced by perturbing this target. To get the sole gene signature of this target, we exploited a library of gene transcriptional responses to different perturbagens (e.g. small molecule compounds and shRNAs): the newly expanded Connectivity Map (CMap).We collected gene targets of all perturbagens from the CMap Linked User Environment (CLUE).Then, each target was mapped to its transcriptional signatures that are the differential gene profiles induced by the perturbagens of the target including both small molecule compounds and shRNAs. Finally, we combined its transcriptional signatures into a consensus signature, and the consensus gene signatures were successfully constructed for 3,275 targets.
Gene signatures for Pathological processes
we created a catalog of pathological processes and their related genes by a few steps. Firstly, we obtained 457 distinct pathological process terms from MeSH and 21,338 genes have records of articles from NCBI FTP systems. Then we curated all pp-gene relationships from the scientific literature by a manual and automated screening. For a pathological process, its significantly related genes are regarded as the core gene members. We anticipated that genes significantly co-expressed to these core genes would be mostly relevant to the pathological process. Therefore, we created the gene set to represent the pathological process by integrating core genes and their top co-expressed genes on the whole genome scale. Co-expressions of core genes were identified by using a query-level cross-validation–based algorithm, implemented in the computational gene co-expression search engine SEEK (Search-Based Exploration of Expression Compendium, http://seek.princeton.edu/) . The resulting genes with co-expression score > 0 and P value < 0.01 in SEEK were regarded as co-expressed genes of query core genes. Finally, we cataloged the relationships of 437 pathological processes and 14,748 genes.
Gene signatures for human cells
we constructed a catalog of gene signatures for different cells centered on the cell marker genes and their corresponding co-expressed genes. For each type of cell, the cell marker genes were collected from the CellMarker database and the corresponding co-expressed genes were identified from SEEK. Finally, we constructed 2431 gene signatures for 460 cell types in 155 human tissues corresponding 13,605 genes and each signature averagely contains 397 genes.
Gene signatures for human tissues
The human tissue-specific gene expression data were collected from the UCSC xena. The data contain 7862 samples that can be attributed to 31 primary tissue sites. For each sample, its differential gene expression profile was defined as the normalized expression values of genes relative to that of all other samples and can be calculated by the z-score method. Then, for each tissue, we combined all differential expression profiles of the samples belong to this tissue into a single gene list. This merged gene list equally weights the contribution of all samples to gene expressions and can be used as a consensus signature to represent the corresponding tissue at the transcriptional level.
Algorithms of multi-scale association analysis
TMNP considers experiments with gene expression profiles from a collection of samples belonging to two classes, for example, herb treated vs. control. The genes can be ordered in a ranked list L, according to their differential expression between the classes. Given the defined multi-scale gene signatures, the goal of TMNP is to compare the query L to each scale using a gene set-based similarity metric slightly adjusted from that used in Gene Set Enrichment Analysis. Based on the types of signatures, the association analyses were divided into two categories: signatures with one gene set, and signatures with a ranked gene list.
Calculation of correlation scores for signatures with one gene set
Signatures with one gene set are those at the levels of GO biological process, pathway, pathological process, cell and disease. The correlation score (CS) of the query gene list L against each signature was measured using the same method with GSEA. We assess the significance of an actual CS value by comparing it with the set of scores CSNULL computed with random permutations of the query gene list. We generated a random space of query gene lists by randomly permuting genes in the query gene list L for 1000 times, and create a histogram of the corresponding similarity scores CSNULL for the signature. Then, a nominal P value for the CS is estimated by using the positive or negative portion of the distribution corresponding to the sign of the actual CS, as follows:
$$P = \frac{N(CS_{NULL} ≥ CS)} {N(CS_{NULL} ≥ 0)}, CS ≥ 0$$ $$P = \frac{N(CS_{NULL} < CS)} {N(CS_{NULL} < 0)}, CS < 0$$Normalization of correlation scores and adjustment for multiple hypothesis testing
we normalize the CS for each gene signature to account for the size of the signature, yielding a normalized enrichment score (NCS):
$$NCS_L^i = \frac{CS_L^i} {mean(CS_{NULL}^i)}, sing(CS_L^i) = sing(CS_{NULL}^i)$$where \(CS_L^i\) is the actual correlation score of the signature i, and the \(CS_{NULL}^i\) is the set of the correlation scores of the signature i against random permutations of the query gene list L with same signs to \(CS_L^i\). By normalizing the correlation score, TMNP accounts for differences in gene signature size and in correlations between gene signatures and the query gene lists. We then control the proportion of false positives by calculating the false discovery rate (FDR) corresponding to each NCS. The FDR is the estimated probability that a signature with a given NCS represents a false positive finding; it is computed by a ratio of two distributions: (A) the actual correlation score versus the correlation scores for all gene signatures against all permutations of the query gene lists and (B) the actual correlation score versus the correlation scores of all gene signatures against the actual gene lists:
$$A = \frac{N(NCS_{NULL} ≥ NCS_L^i)} {N(NCS_{NULL} ≥ 0)}, NCS_L^i > 0$$ $$A = \frac{N(NCS_{NULL} ≤ NCS_L^i)} {N(NCS_{NULL} ≤ 0)}, NCS_L^i < 0$$ $$A = \frac{N(NCS_{actual} ≥ NCS_L^i)} {N(NCS_{actual} ≥ 0)}, NCS_L^i > 0$$ $$A = \frac{N(NCS_{actual} ≤ NCS_L^i)} {N(NCS_{actual} ≤ 0)}, NCS_L^i < 0$$ $$FDR_L^i = \frac{A} {B}$$Where \(NCS_L^i\) is the actual normalized correlation score of the signature I against the gene list L. \(NCS_{NULL}\) are the correlation scores for all gene signatures against all permutations of the query gene lists. \(NCS_{actual}\) are the correlation scores of all gene signatures against the actual gene lists.
Calculation of total correlation scores for signatures with a ranked gene list
Signatures with a ranked gene list are those at the levels of target gene or human tissue. To reduce the calculation burden, and is suitable for TMNP analysis, we can extract two gene sets including the top n genes (Gup) and the bottom ones (Gdown) from the gene signatures as the signature specific gene module pair (Gup, Gdown). The number n variable and can be denoted in TMNP. We defined the raw similarity score between the query gene list L and the signatures as follows:
$$TCS_L = CS_L^{up} - CS_L^{down}$$Where \(CS_L^{up}\) is the enrichment of Gup for L and \(CS_L^{down}\) is the enrichment of Gdown for L. \(TCS_L\) denotes the Total Correlation Score of the gene module pair (Gup, Gdown), with respect to the query gene list L.
Estimating significance of total correlation scores
Similar to the significance evaluation of correlation scores above, We assess the significance of an actual TCS value by comparing it with the set of scores TCSNULL computed with random permutations of the query gene list, as following:
$$P = \frac{N(TCS_{NULL} ≥ TCS)} {N(TCS_{NULL} ≥ 0)}, TCS ≥ 0$$ $$P = \frac{N(TCS_{NULL} < TCS)} {N(TCS_{NULL} < 0)}, TCS < 0$$Normalization of total correlation scores and adjustment for multiple hypothesis testing
Similar to the above for normalization of correlation scores, TMNP normalizes the TCS values within each ranked gene list as follows:
$$NCS_L^i = \frac{TCS_L^i} {mean(TCS_{NULL}^i)}, sing(TCS_L^i) = sing(TCS_{NULL}^i)$$where \(TCS_L^i\) is the actual total correlation score of the signature i, and the \(TCS_{NULL}^i\) is the set of the total correlation scores of the signature i against random permutations of the query gene list L with the same signs to \(TCS_L^i\). Similarly, the FDR accounts for the multiple hypotheses testing and is estimated by comparing the tails of the observed and null distributions for the NCS.
Two cases
TMNP that integrates herbal medicine and multiple biological scales into a same framework for multi-scale association analysis, will greatly extend the conventional network pharmacology model centering the chemical components, and provide a window for systematically observing the complex interactions between herbal medicine and human body.
Analysis of a single herb Astragalus membranaceus in TMNP
Astragalus membranaceus Bge. var. mongolicus (Bge.) Hsiao (AM in short; Huang Qi in Chinese), a traditional Chinese medicine, is one of the common herbs widely used in the South and East Asia. AM was reported to possess anti-inflammation, anti-oxidation, anti-diuretic, antitumor, anti-perspirant and immunopotentiative effects. However, the knowledge about global effect of AM is limited. We here use AM as an example to demonstrate the usage of TMNP for exploration of the multi-scale effects of a single herb. We collected AM induced transcriptional data from the microarray experiment deposited in GEO (GSE accession: GSE70772), which detects expression genes from colon cancer cell HCT116 mouse xenograft and includes two groups of control and AM-treated.
Following the instruction of TMNP, the differential profile was submitted to TMNP and was connected to the multi-scale signatures including target genes, pathways, Go processes, pathological processes, cells and tissues.
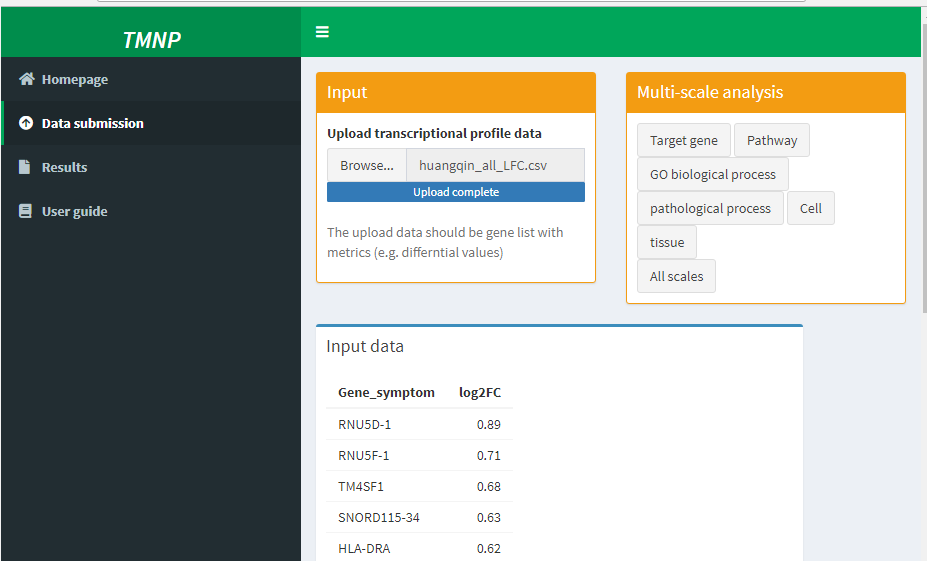
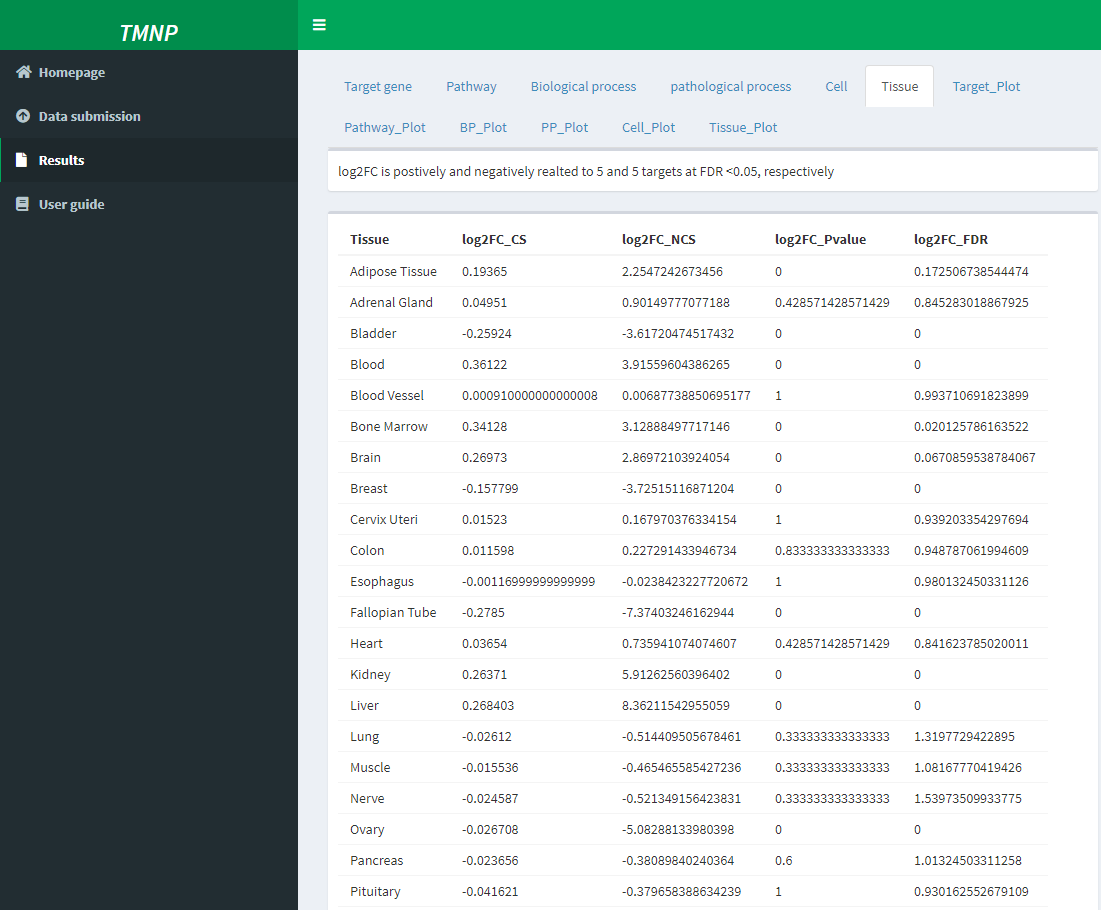
Then the results incuding the detaled result table and analysis figures can be downloaded from the result page
We observed that AM could significantly regulate a large number of signatures in each scale. This is reasonable considering the multi-target and multi-function features of herbal medicine.
In addition, For each scale, the distribution of NCS was displayed and we can observed that AM has distinct impacts on positive and negative parts of these biological scales.
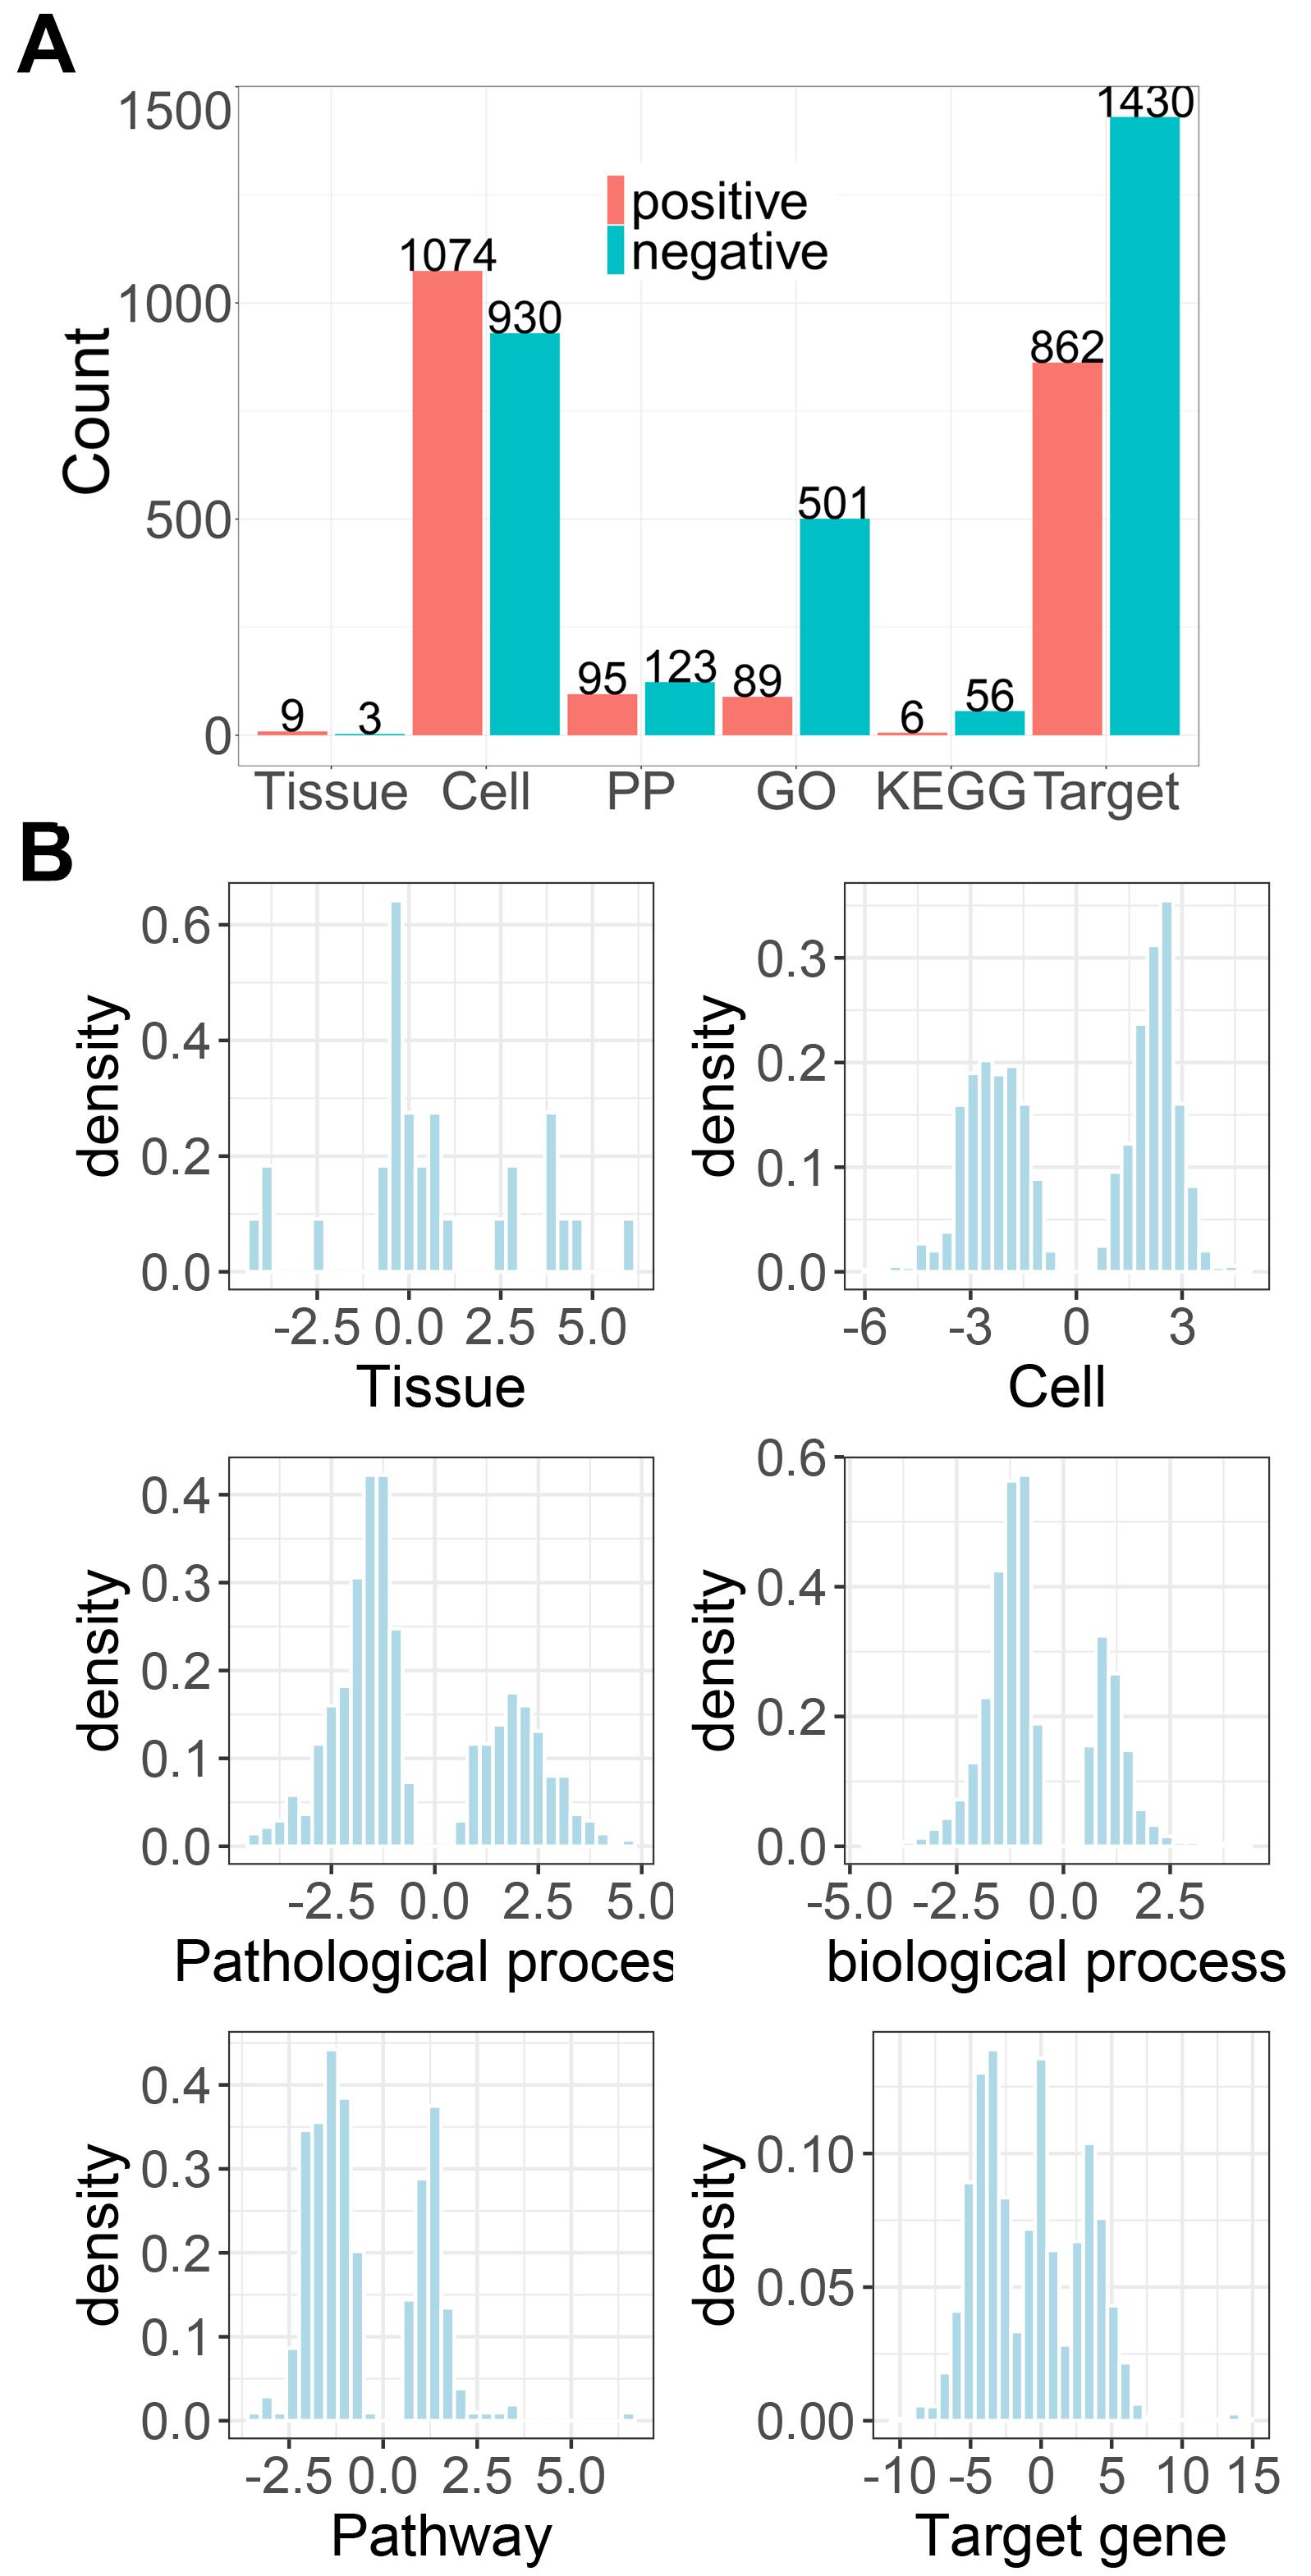
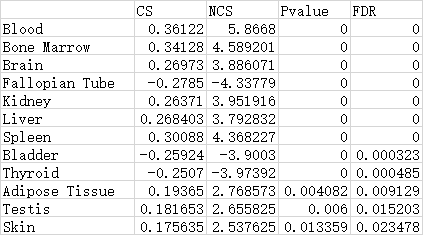
Moreover, we can inspected the detailed associaitons between herbs and each scale. For example, Out of the 12 significantly related tissues, AM positively regulated Blood and Bone marrow with NCS of 5.87 and 4.59, followed by Spleen (NCS=4.36), Kidney (NCS=3.95), Brain (NCS=3.89) and Liver (NCS=3.79), suggesting AM strongly enhances the function of these tissues, especially Blood and “Bone marrow??? (Table 1). This is in agreement with the traditional use of AM that is widely used as a tonic to enhance the body's natural defense mechanisms and also the pharmacological action of AM on bone marrow-derived cells.
In summary, here we took AM as an example to show the functions of TMNP to explore the multi-scale effects of a single herb, and found AM can impact multiple signatures in all scales. This is consistent with the multi-functional feature of herb medicine. More important, inspection of the top signatures regulated by AM indicates the main function of AM is to enhance the hematopoietic and immune systems, in agreement with the traditional use of AM as a tonic to enhance the body's natural defense mechanisms. This case proves TMNP is a powerful tool for TCM multi-scale research.
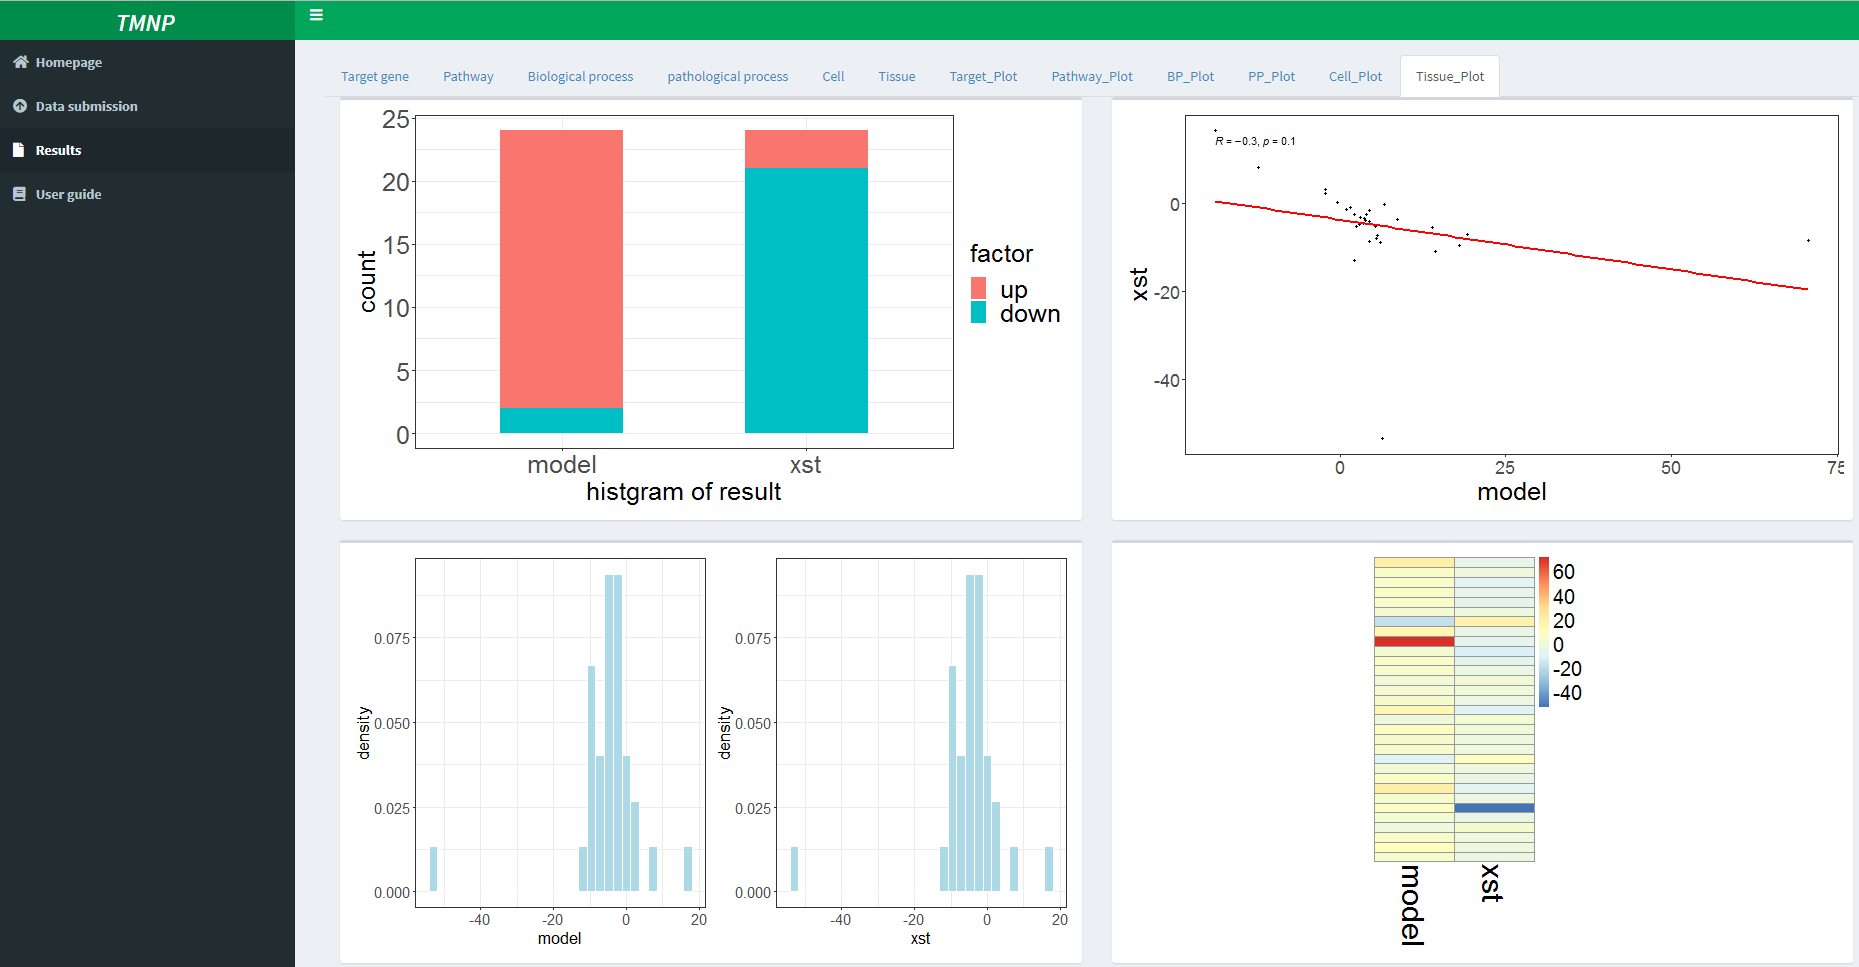
Multi-scale analysis of Xuesaitong injection against stroke
This section displays the application of TMNP on multiple queries of gene expression profiles for comparison analyses. As an example, the multi-scale effects of Xuesaitong injection (XST) against ischemic stroke were explored in TMNP based on the transcriptional data induced by the cerebral ischemia-reperfusion injury (Model) and the XST treatment. XST is a standardized patent Chinese medicine of Panax notoginseng roots (Sanqi in Chinese), and has long been used for prevention of stroke in China. Their transcriptional data were obtained from the microarray experiment deposited in GEO (GSE accession: GSE61616) and were submitted to the TMNP website.

Based on the multi-scale analysis, we can compare the two groups in all scales and found XST can reversed the most effects of the disease model. And the analysis of the top signatures indicates that the regulation of macrophage function is pivotal for the treatment of XST, and provides plenty of clues for further mechanism study. This case displays the application of TMNP on the multi-scale research of TCM based on multiple queries.The result showed that the XST treatment definitely reverses the effects of the disease model, consistent with its therapeutic ability for the stroke in clinic.
Moreover, we compared the detailed signatures that are significantly influenced by the disease model and XST. And as expected, the impact is greatest in the pathological site, brain, with NCS of -15.27 and 12.35 for the disease model and XST, respectively.
Moreover, we compared the detailed signatures that are significantly influenced by the disease model and XST. For example, in the tissue scale, the impact is greatest in the pathological site, brain, with NCS of -15.27 and 12.35 for the disease model and XST, respectively.In the cell scale, the main types of cells include neuron, lymphoid cell, microglial cell and macrophage. Similarly, other scales can also be analyzed.
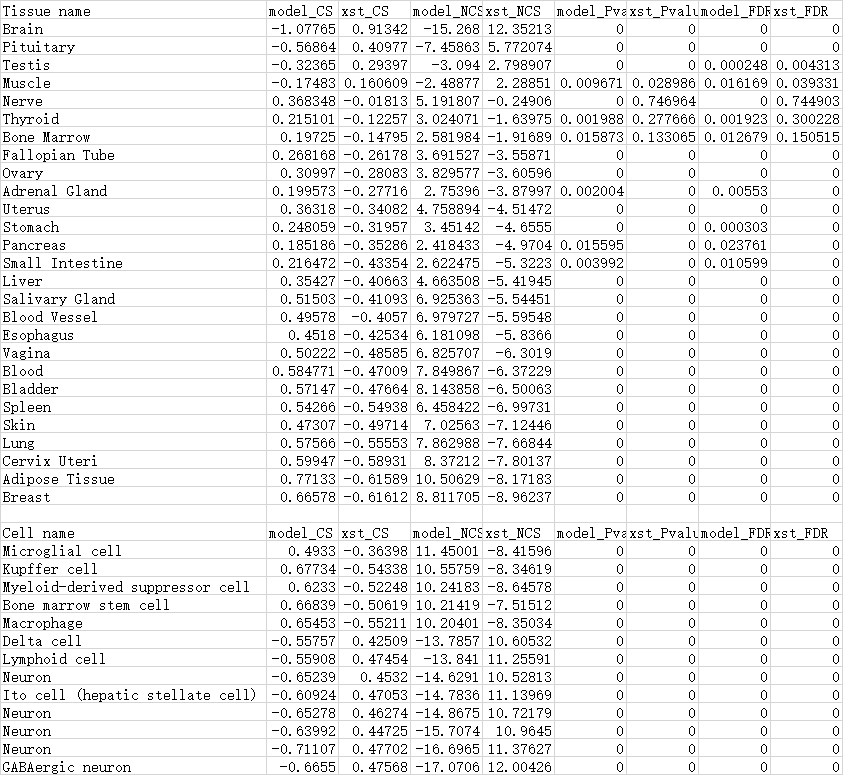
And the analysis of the top signatures indicates that the regulation of nevious and immunological function is pivotal for the treatment of XST, and provides plenty of clues for further mechanism study. This case displays the application of TMNP on the multi-scale research of TCM based on multiple queries.
In summary, TMNP takes herbal medicine as a whole, and uses the herb-induced transcriptional profiles to represent the biological effects of herbs, providing an effective way for studying the multi-scale connections of herbal medicine with human body.